
About
This how-to shows you how to generate data that follows a The inter-wiki (datacadamia) does not exist and there is no default inter-wiki defined.normal distribution with the column histogram generator.
Steps
Defining the buckets
The bucket list needs a serie of value and their respective factor.
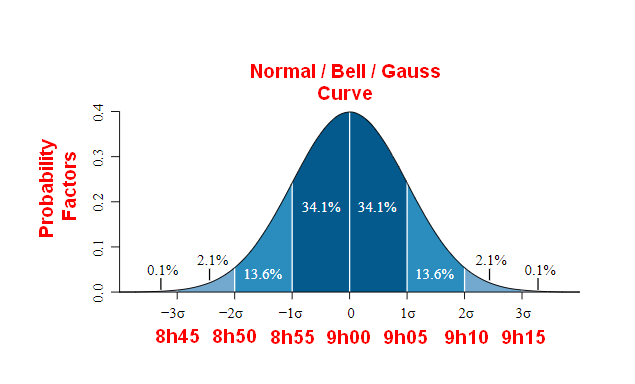
We will simulate the arrival of people at an event.
The time will be the value and the factor will follow the probability of the normal distribution.
Example: The below bucket definition:
Buckets:
  "8:45": 0.05
  "8:50": 0.5
  "8:55": 0.22
  "9:00": 0.4
  "9:05": 0.22
  "9:10": 0.5
  "9:15": 0.05
models the below normal distribution:
Creation of the generator file
To generate data, you need to create a generator file that will describe the data to be generated.
The below data resource generator:
- has the name histogram_normal_distribution–datagen.yml
- has the logical name histogram_normal_distribution
- will generate 30 values (MaxRecordCount count)
- has a column named id that has sequence data generator that:
- starts by default at the value 1
- increments by default with the value 1
- has a column named buckets_map with a histogram generator where the buckets property defines a map where:
- the key is the value to generate
- the value is the chance factor of generation:
- the more, the more chance that you get the value generated
- this is the equivalent of the probability value of the distribution.
MaxRecordCount: 30
Columns:
  - name: id
    type: integer
    comment: A id column to see easily the number of values generated
    DataGenerator:
      type: sequence
  - name: bucket_map
    type: time
    comment: A column with a histogram generator that generates an uniform distribution of time
    DataGenerator:
      type: histogram
      Buckets:
        "8:45": 0.05
        "8:50": 0.5
        "8:55": 0.22
        "9:00": 0.4
        "9:05": 0.22
        "9:10": 0.5
        "9:15": 0.05
Printing the data
With the data print command, we can print the 30 values generated.
tabli data print histogram_normal_distribution--datagen.yml@howto
id   bucket_map
--   ----------
 1   08:45:00
 2   09:15:00
 3   09:05:00
 4   09:05:00
 5   08:50:00
 6   09:00:00
 7   08:50:00
 8   09:05:00
 9   09:05:00
10   08:45:00
11   08:50:00
12   08:55:00
13   09:15:00
14   08:50:00
15   08:55:00
16   09:15:00
17   08:50:00
18   08:50:00
19   09:05:00
20   09:00:00
21   09:10:00
22   08:50:00
23   08:50:00
24   09:10:00
25   09:05:00
26   09:10:00
27   09:00:00
28   09:15:00
29   09:05:00
30   09:05:00
Next
Because a generator is just a data resource, you can use it in every data operation.